A selection of solutions I enjoyed creating that showcases my skills in building pipelines, semantic layer, AI context, dashboarding and understanding different problems.
Would you be interested in reading my thoughts on data and life? read
Disclaimer: To avoid AI slop, most descriptions and details here will be precise and bare minimal.
Dashboards
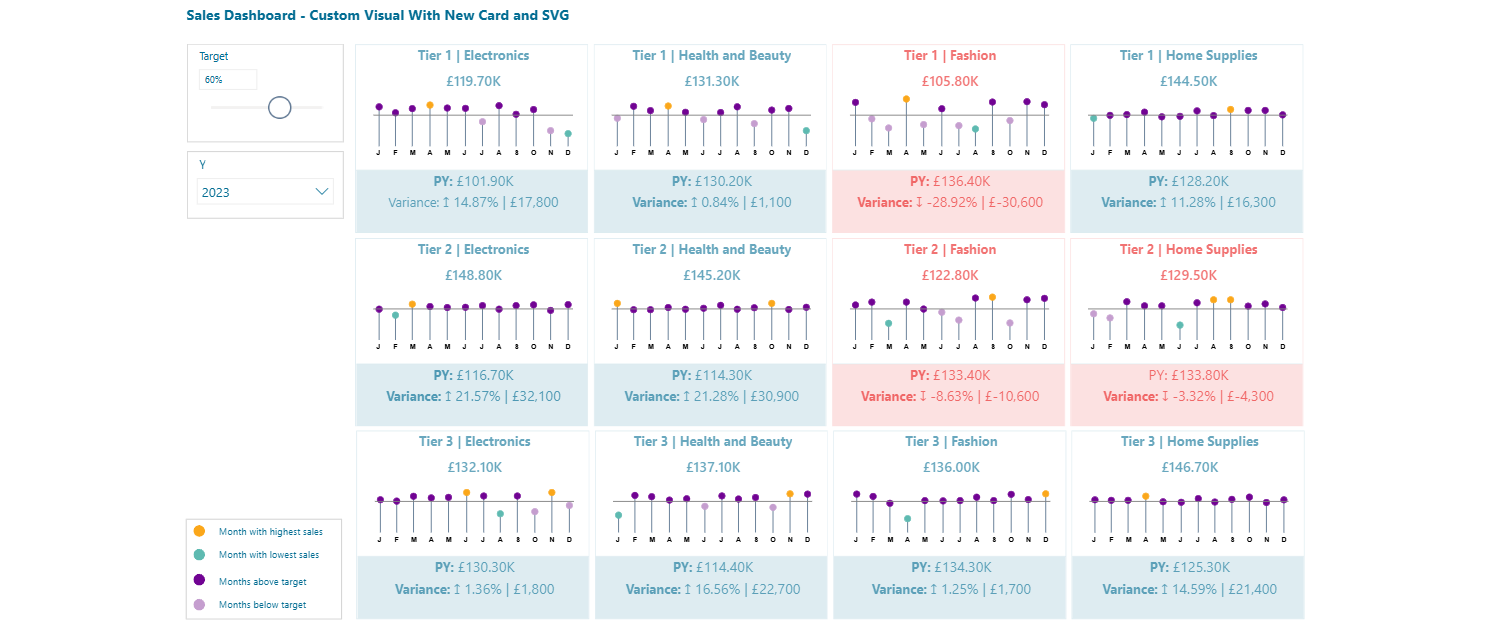 Executive Sales Summary
Executive sales summary using bespoke SVG visuals
Power BI
Executive Sales Summary
Executive sales summary using bespoke SVG visuals
Power BI
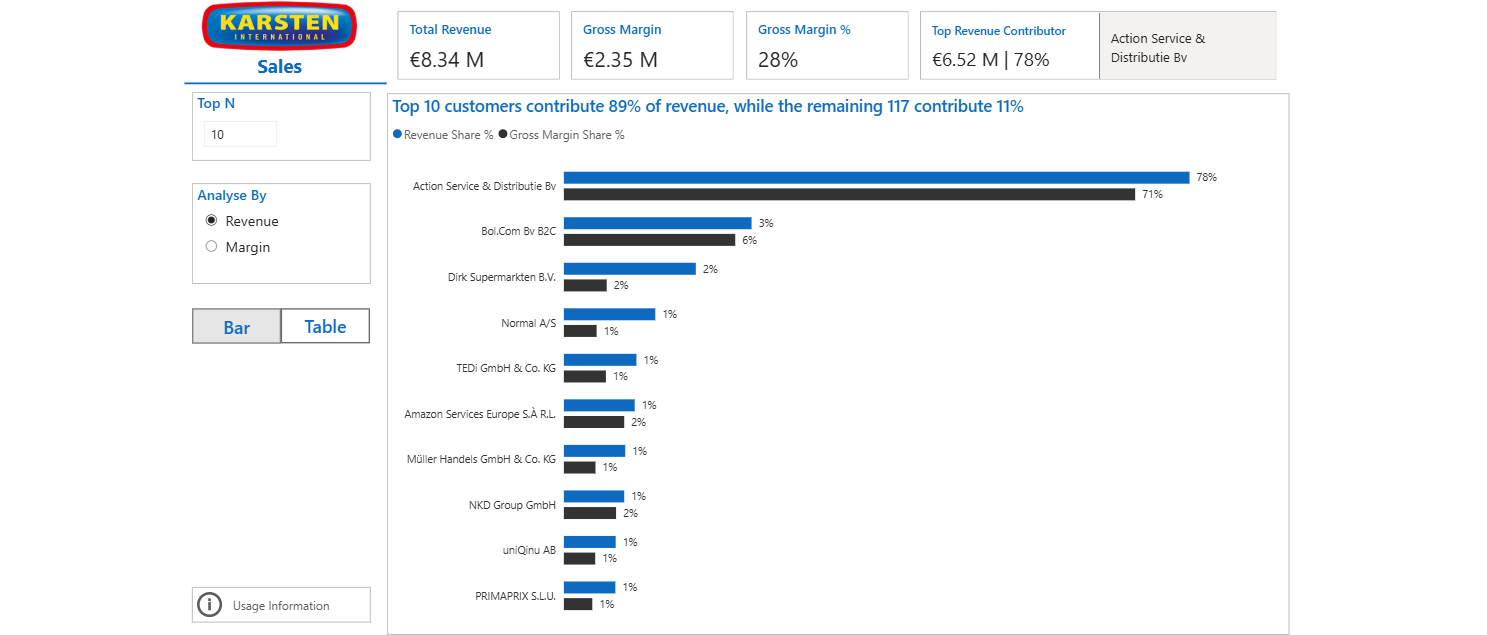 Sales & Margin Performance
Interactive and highly dynamic sales explorer focused on helping users self-serve and analyze on a wide range of questions.
Power BI
Sales & Margin Performance
Interactive and highly dynamic sales explorer focused on helping users self-serve and analyze on a wide range of questions.
Power BI
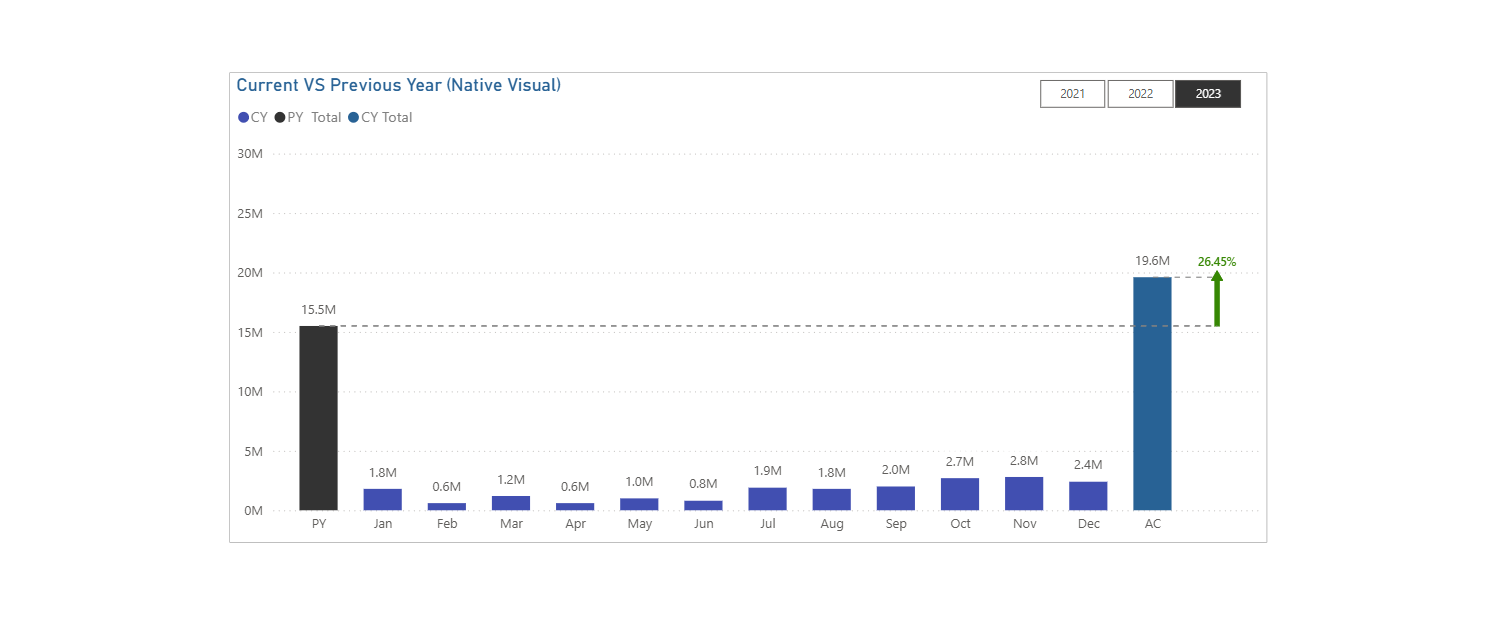 Sales Comparison
Sales comparison across different period using a more creative visual approach.
Power BI
Sales Comparison
Sales comparison across different period using a more creative visual approach.
Power BI
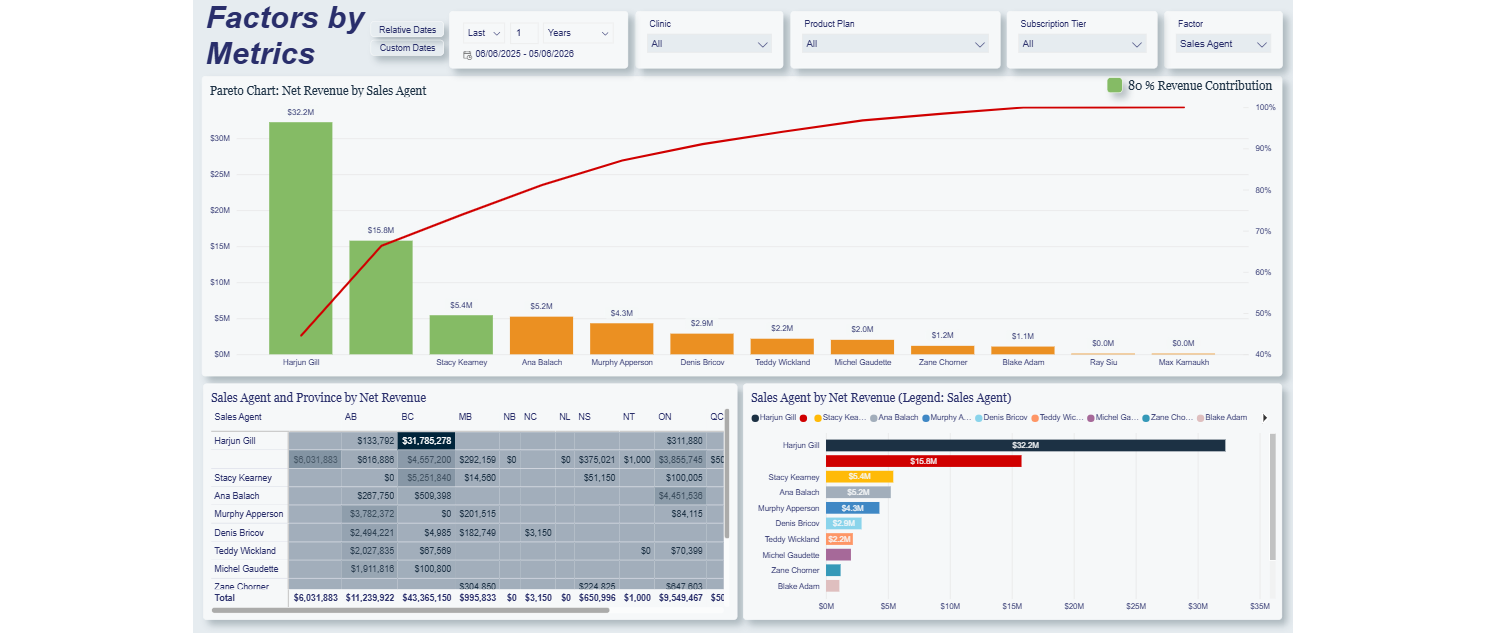 Sales Agent Performance Report
End-to-end sales agent performance view
Power BI
Sales Agent Performance Report
End-to-end sales agent performance view
Power BI